· Finance · 8 min read
Prime Cost Management: The One Number That Predicts Restaurant Profitability
Prime cost — total food, beverage, and labor costs as a percentage of sales — is the single most predictive financial metric in the restaurant industry. Here is what it means and how to hit your target.
Every industry has a financial metric that, when monitored consistently, predicts everything else. In restaurants, that metric is prime cost.
Prime cost combines cost of goods sold (food and beverage) with total labor costs — wages, benefits, payroll taxes — and expresses the total as a percentage of net sales. If your restaurant generates $100,000 in monthly revenue with $35,000 in COGS and $25,000 in labor, your prime cost is 60%. Most of your remaining decisions about profitability flow from where that 60% sits relative to your target and what levers you have available to move it.
Baker Tilly, a national accounting and advisory firm with deep hospitality practice experience, is unambiguous about this metric’s importance: prime cost is the single most important financial metric for restaurant operators. Everything else on the P&L — occupancy, marketing, utilities, administrative costs — matters, but managing prime cost determines whether there is margin left to cover those costs and generate profit.
The Targets
Prime cost targets vary by restaurant type and revenue volume. According to Baker Tilly’s analysis:
- Restaurants with $850,000+ in annual sales: Target 55% or under
- Restaurants with under $850,000 in annual sales: Target 60%
- Full-service restaurants broadly: 60-65% prime cost
- Quick-service restaurants: 55-60% prime cost
The rationale for the volume-based distinction is economies of scale. Higher-revenue restaurants can distribute fixed labor costs — management, kitchen leadership, administrative staff — across more covers and more revenue. A restaurant manager earning $60,000 per year represents 6% of revenue at $1 million but only 3% at $2 million. Similarly, bulk purchasing leverage and negotiated vendor pricing improve food cost percentages as volume increases.
The hard ceiling: a prime cost above 65% makes profitability extremely difficult regardless of restaurant type. At 65% prime cost, the remaining 35% must cover rent, utilities, marketing, repairs, debt service, insurance, administrative costs, and still produce profit. In most markets, that arithmetic does not work.
Lightspeed’s 2025 restaurant cost benchmarks confirm the pressure operators are facing: with beef prices up 60%, fats up 50%, and eggs up 40% year-over-year, maintaining prime cost targets requires active management rather than passive monitoring. The same prime cost percentage that was achievable two years ago now requires tighter controls in procurement, portioning, and labor scheduling.
Breaking Down the Components
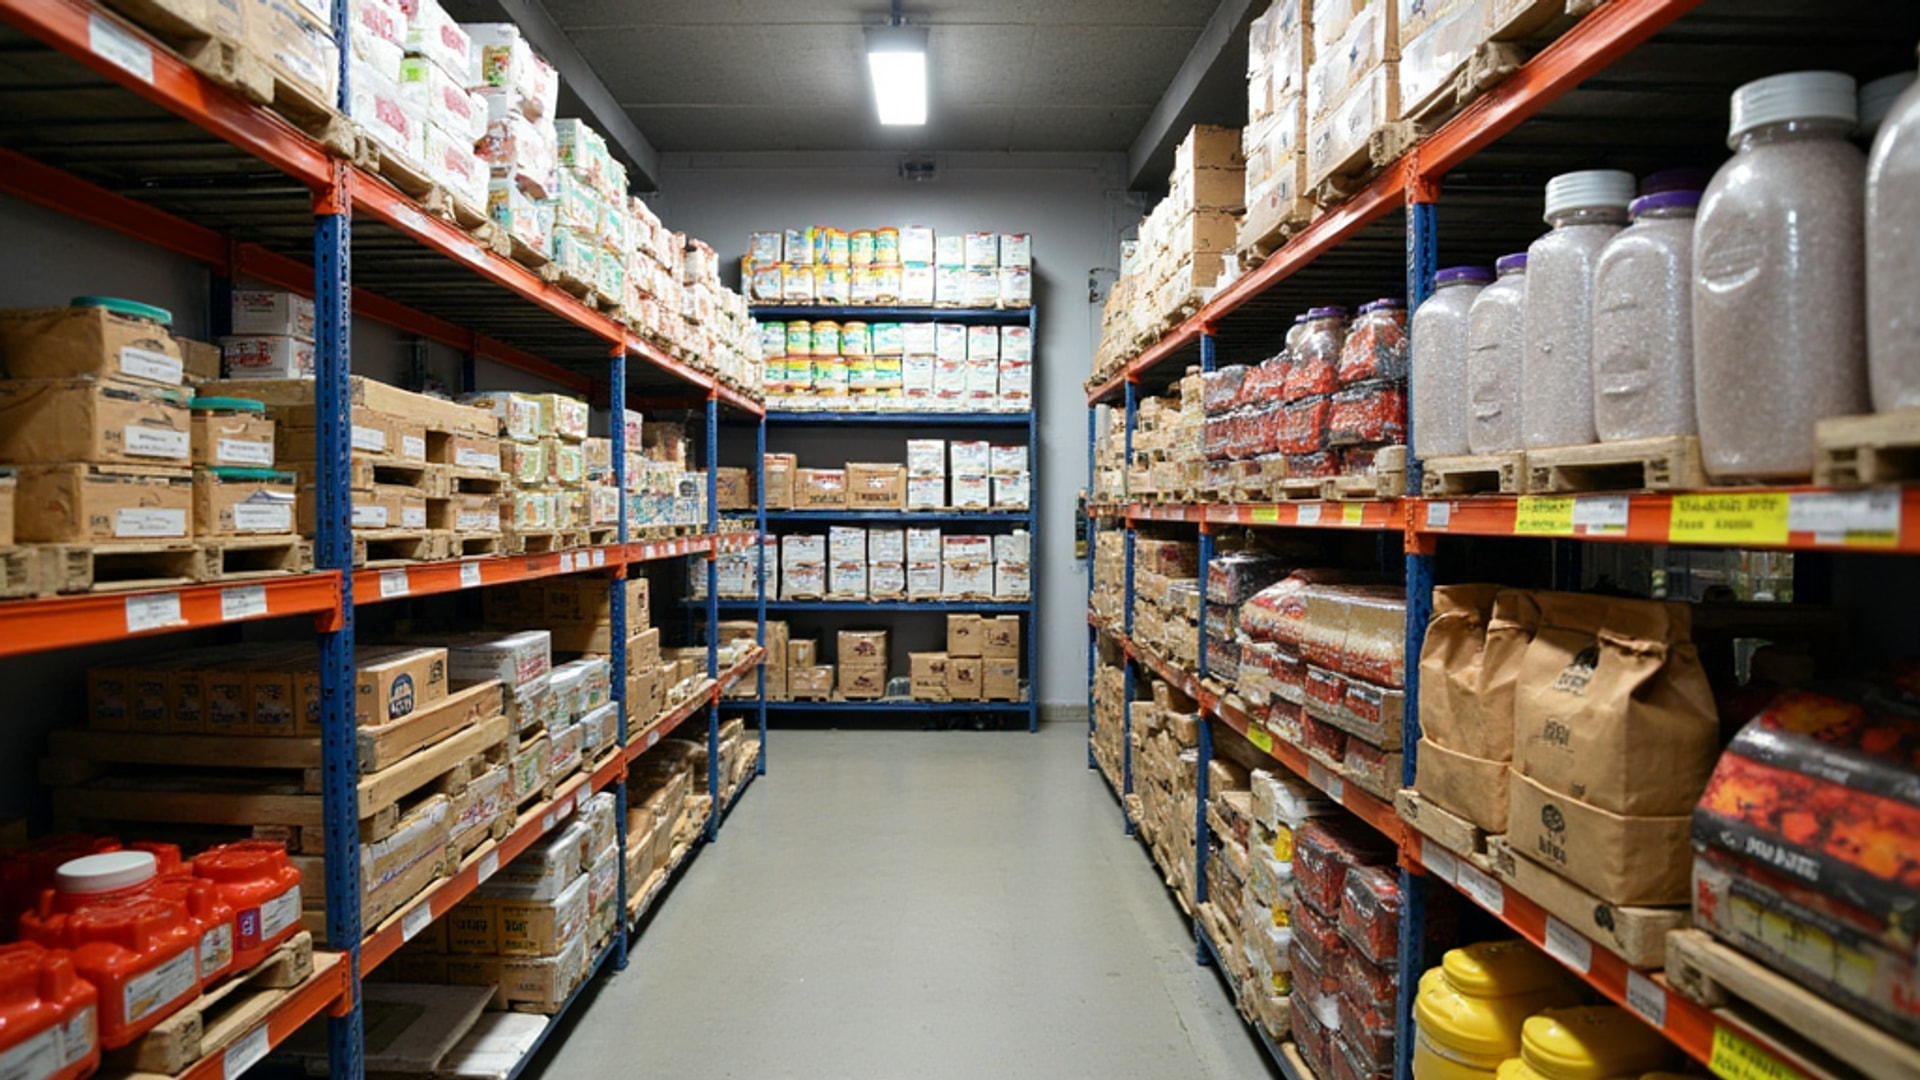
Food and Beverage Cost (COGS)
For most restaurants, the ideal food cost falls between 28-35% of food sales, depending on concept and location, according to ChowNow’s analysis of cost control practices. Beverage cost (for restaurants with bar programs) typically runs 18-24%. The combined COGS reflects both the food-to-beverage sales ratio and the efficiency of kitchen operations.
The most common drivers of COGS variance above target:
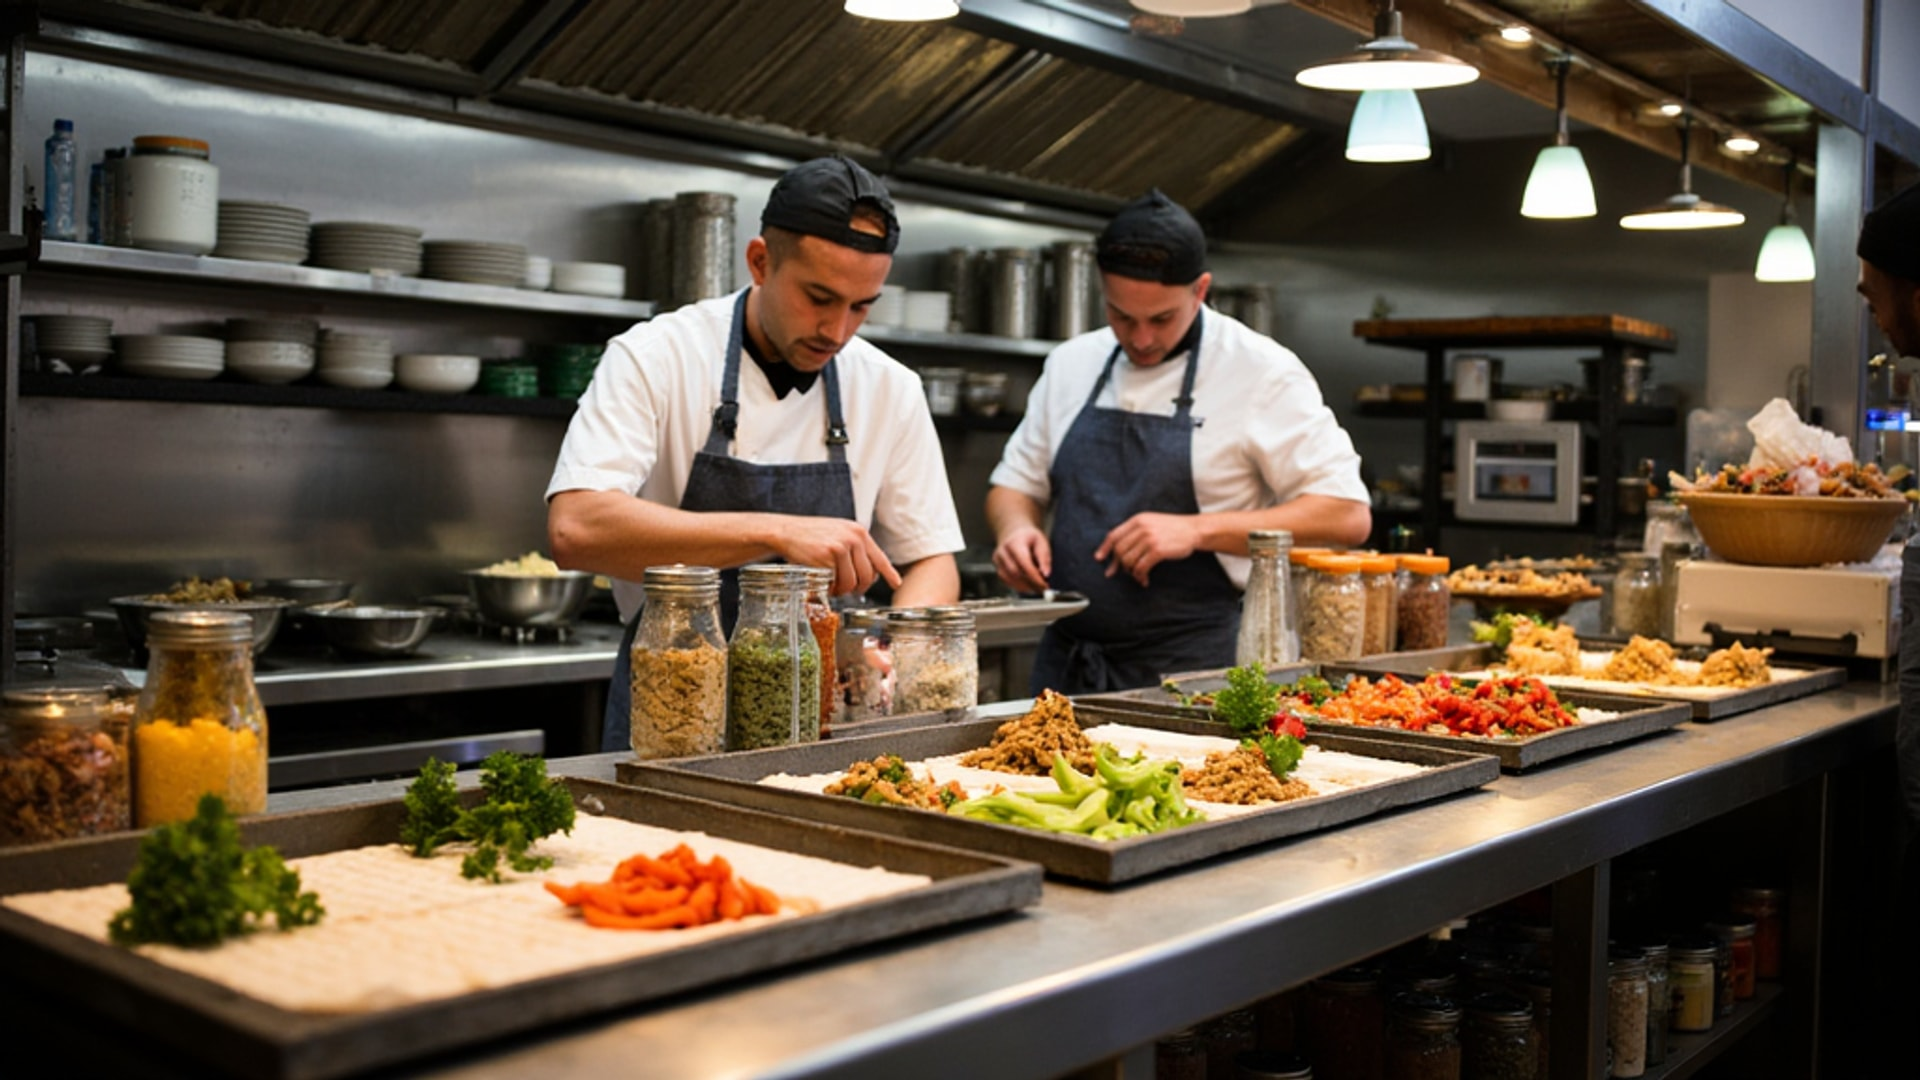
Portion inconsistency: Without standardized recipes and portion weights, kitchen output varies. A dish plated with 5 oz of protein by one cook and 6.5 oz by another creates a 30% cost variance on that item. Baker Tilly specifically identifies standardized recipes with exact portion specifications as the foundation of COGS control.
Purchasing price increases without menu price response: Food costs have been volatile. Operators who set menu prices based on costs from 12-18 months ago and have not revisited them since are likely running COGS percentages significantly higher than intended. Menu pricing is a cost control lever, not just a revenue lever.
Waste and spoilage: ChowNow’s research indicates that 4-10% of purchased food becomes pre-consumer waste in most restaurants. At 4%, a restaurant with $20,000 in monthly food purchases throws away $800 in usable food. At 10%, that becomes $2,000 per month — $24,000 per year — going into the trash instead of onto plates generating revenue.
Menu complexity: More menu items means more ingredients, more inventory to manage, and more opportunities for spoilage. Lightspeed’s benchmarks suggest keeping menus focused: 6 choices per category for quick-service, 7-10 for fine dining. Every additional ingredient in active use represents inventory that can spoil, be over-ordered, or be costed incorrectly.
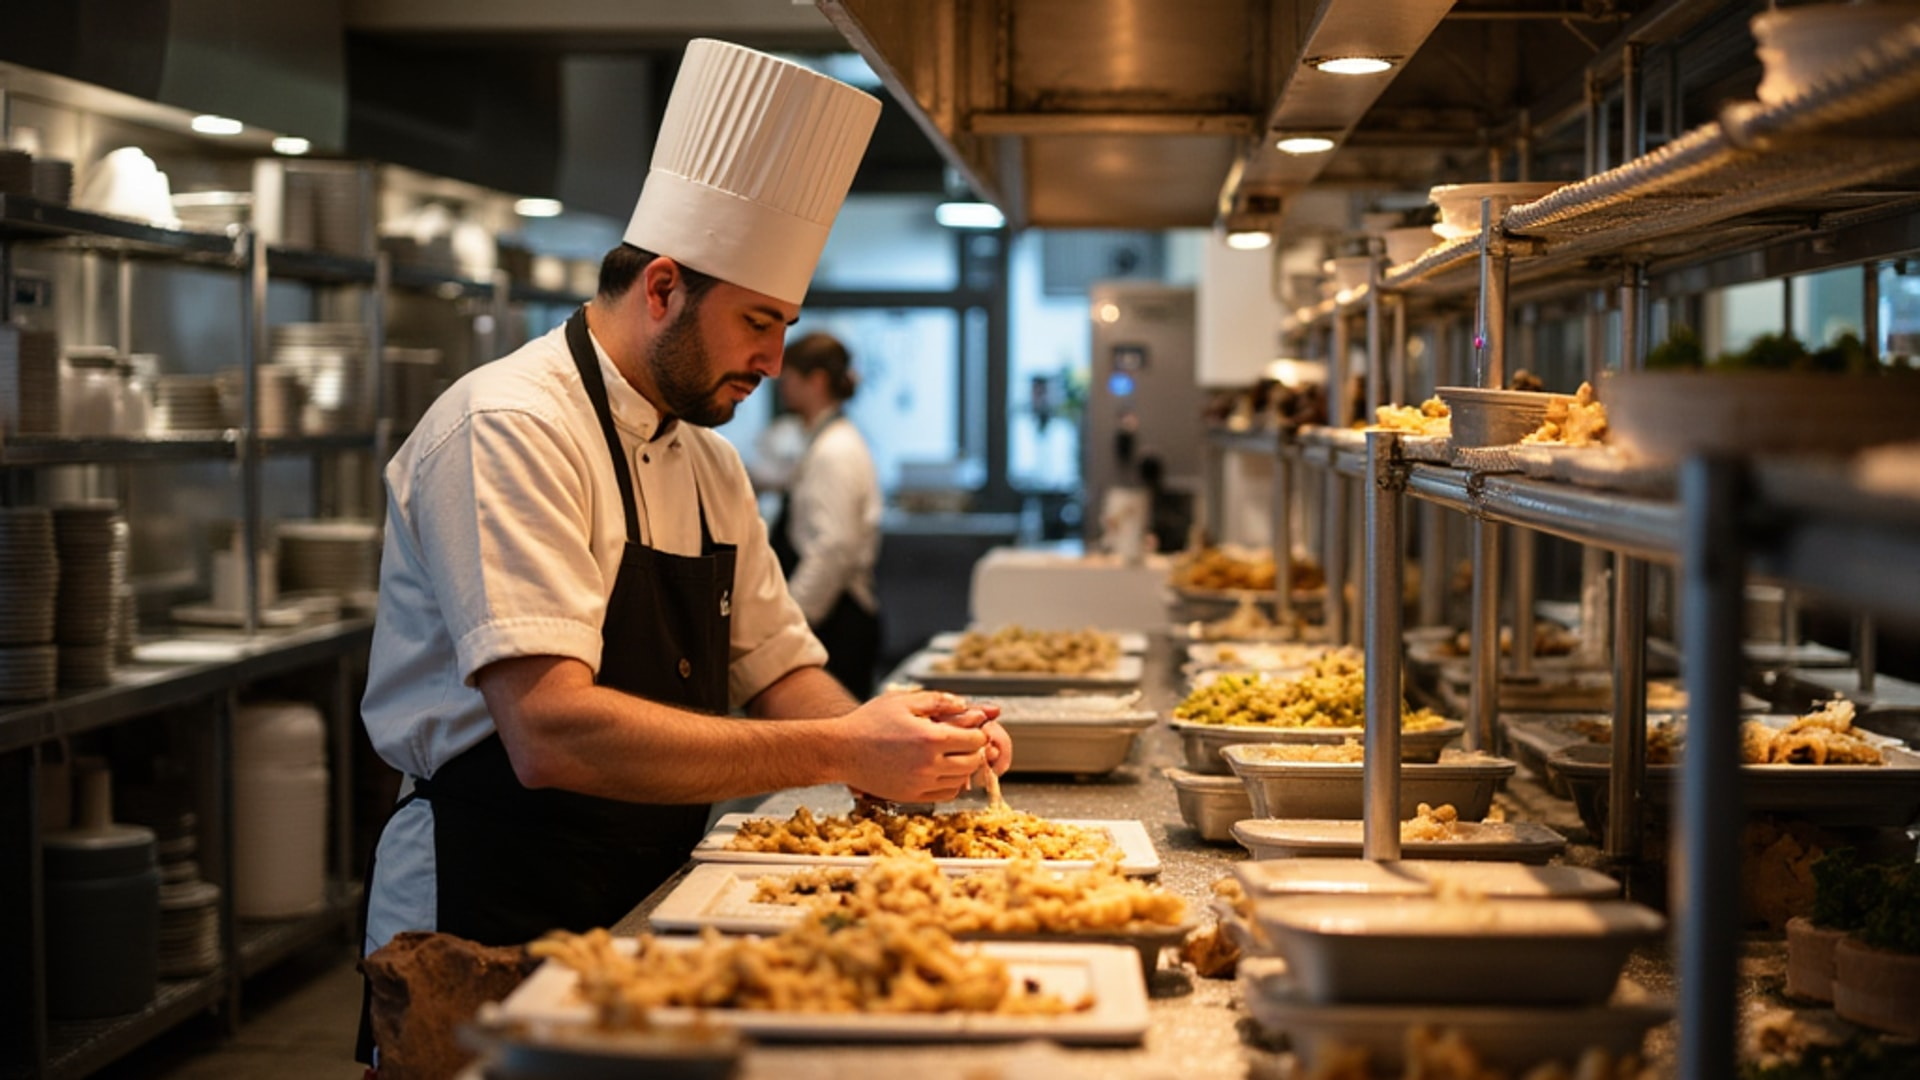
Labor Cost
Labor cost targets typically run 28-35% of revenue for full-service restaurants and 25-30% for quick-service. The target range varies with local minimum wage levels, tipping customs, and the restaurant’s service model.
Labor cost management is frequently misunderstood as “cutting hours” — which often results in service failures, staff burnout, and ultimately higher turnover costs (estimated at $5,864 per employee in hospitality, according to Lightspeed). The better frame is scheduling precision: having the right number of people for the anticipated volume, no more and no less.
Specific tactics from Baker Tilly and ChowNow’s practitioner research:
Schedule from historical sales data: Labor schedules built from last week’s or last year’s sales data align staffing with actual demand patterns. Schedules built from habit, convenience, or requests consistently over-staff slow periods and under-staff busy ones.
Cross-training as a cost control tool: Cross-trained employees who can work multiple stations reduce minimum staffing requirements. One cross-trained line cook who can work both saute and grill reduces the need for two specialists who can each only work one station during partial-volume services.
Management-to-hourly ratio: As volume falls during slow periods, the management overhead (which is largely fixed) becomes a larger percentage of labor cost. Baker Tilly notes that lower-volume restaurants run higher prime costs partly because of this ratio — management salaries represent a higher percentage of total labor.
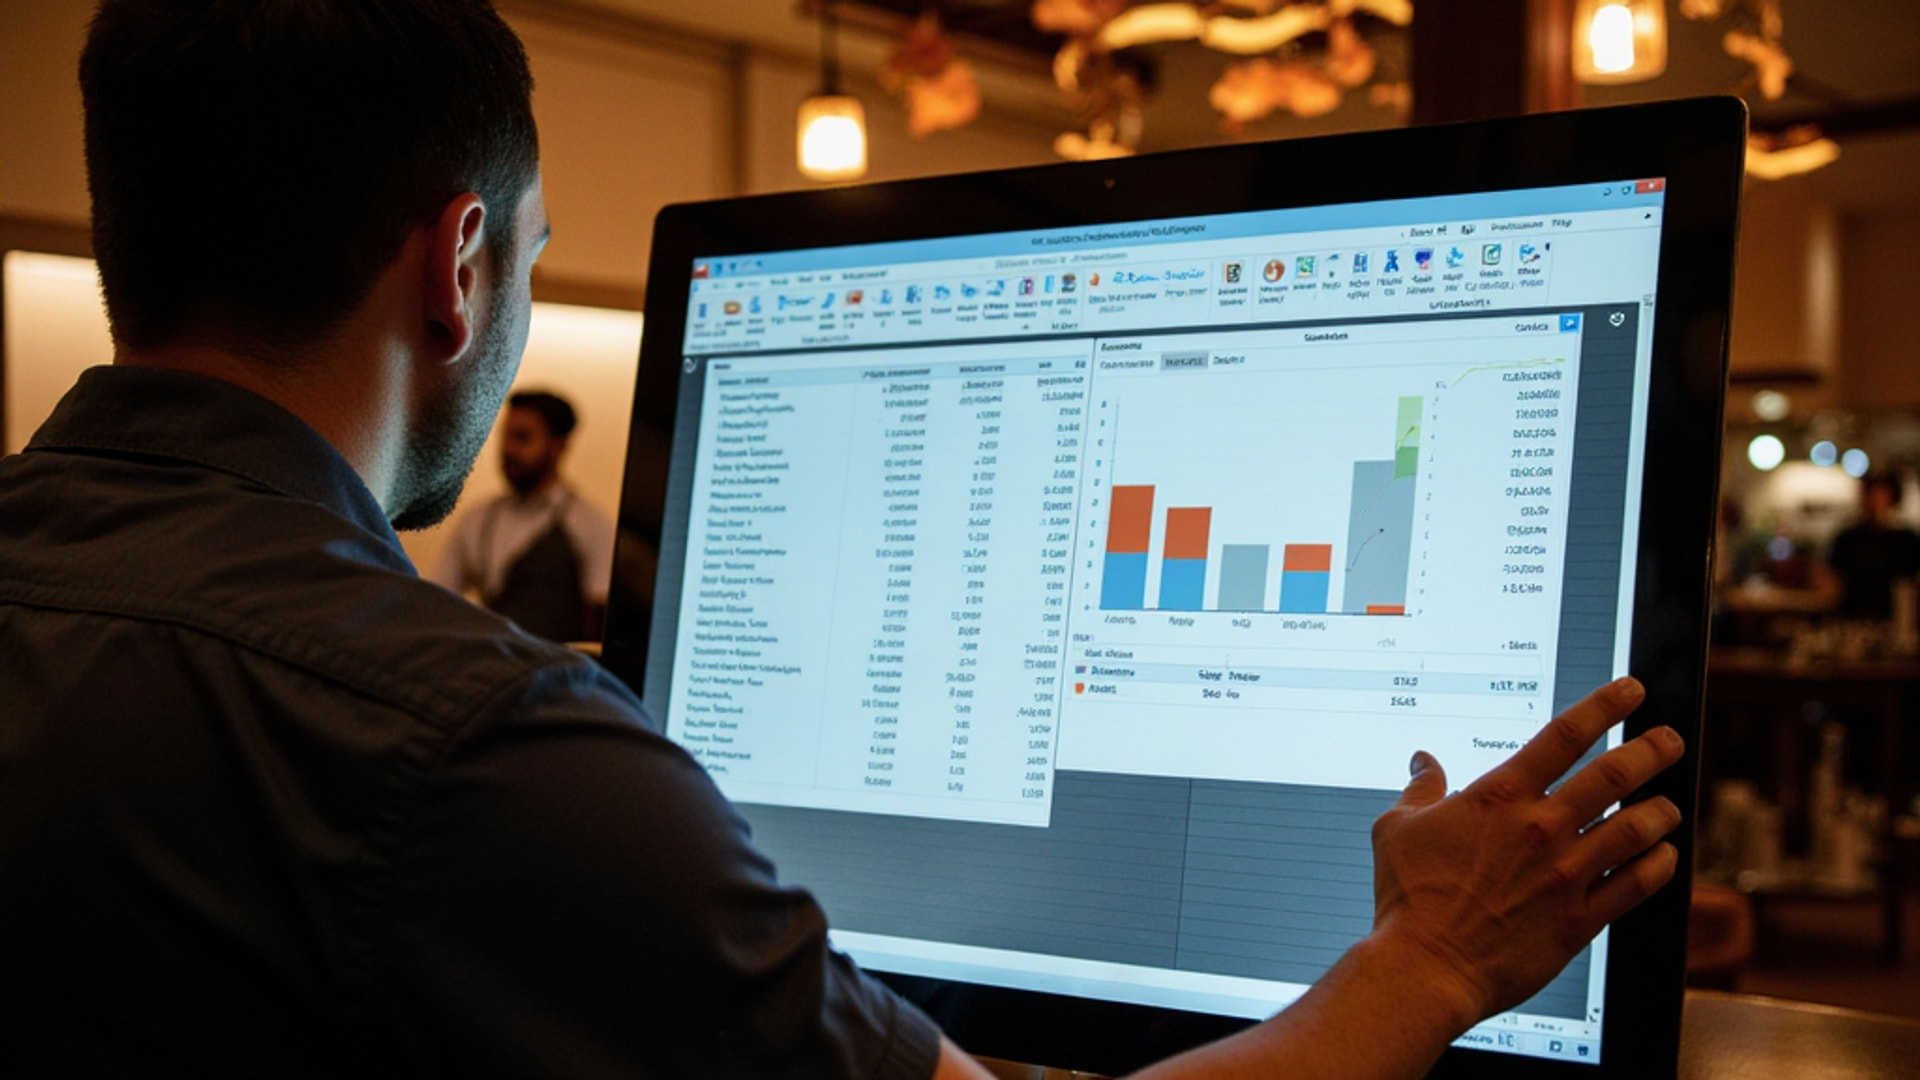
Technology investment: Lightspeed identifies POS systems with real-time analytics and labor tracking as direct contributors to labor cost reduction. When managers can see current labor percentage in real time during service, they can make staffing adjustments before labor overruns become embedded in the day’s cost.
Weekly Tracking: The Non-Negotiable Standard
Baker Tilly is explicit: weekly prime cost tracking is the minimum standard for margin control. Monthly P&L analysis catches problems too late. A labor cost problem that develops in week one of the month shows up in month-end financials three weeks later — after 21 more days of margin erosion have occurred.
The calculation structure for weekly prime cost tracking:
- Pull weekly food and beverage purchases (paid invoices for the week)
- Pull beginning and ending inventory (or use a theoretical cost if weekly physical counts are impractical)
- Calculate COGS: beginning inventory + purchases - ending inventory
- Pull total labor costs: wages, payroll taxes, and benefits for the week
- Divide total (COGS + labor) by the week’s net sales
This calculation does not require sophisticated software. A spreadsheet with a consistent weekly template produces the metric. What produces results is reviewing the output weekly and responding to variances within that same week — not three weeks later.
What 65% Prime Cost Actually Means
To understand why prime cost control determines profitability, model what is left after prime cost at different percentage levels against a realistic operating expense structure.
For a restaurant doing $100,000 per month in revenue:
At 55% prime cost: $45,000 remains for all other costs and profit At 60% prime cost: $40,000 remains — $5,000 less At 65% prime cost: $35,000 remains — $10,000 less than the 55% scenario At 70% prime cost: $30,000 remains — $15,000 less than the 55% scenario
Now subtract typical fixed and semi-fixed costs: rent and occupancy ($6,000-$10,000), utilities ($2,000-$4,000), marketing ($1,500-$3,000), insurance ($1,000-$2,000), repairs and maintenance ($1,000-$2,000), and administrative costs ($1,000-$2,000). Total: approximately $13,000-$23,000.
At 55% prime cost, an operator has $22,000-$32,000 remaining before owner compensation and profit. At 65% prime cost, that same operator has $12,000-$22,000 remaining. The entire margin for the owner’s compensation compresses as prime cost rises — which is why every percentage point matters.
Improving Prime Cost When You Miss the Target
Baker Tilly recommends specific actions on each component when prime cost runs above target:
On the COGS side:
- Conduct regular vendor price comparisons and renegotiate based on volume commitment or switching alternatives
- Implement standardized recipe cards with precise portions and enforce their use
- Reduce waste through better inventory management, including FIFO discipline and tighter ordering to actual sales projections
- Engineer the menu to promote higher-margin items through placement, description, and staff training
→ Read more: Food and Labor Cost Control: Managing the Two Expenses That Make or Break Your Restaurant
On the labor side:
- Map scheduling to historical sales data by day part, not to requests or habit
- Identify the lowest-volume periods where staffing can be reduced without service impact
- Review management overhead relative to sales volume — is management structured appropriately for current revenue levels?
- Invest in equipment or technology that reduces labor requirements for specific tasks (automated dishwashing, portion scales, prep efficiency tools)
Baker Tilly’s final principle is worth stating plainly: set specific targets, share them with your management team, and track results publicly against those targets. Prime cost that is tracked but not shared with the people who influence it creates accountability for the owner but not for the team. Prime cost that is tracked, shared, and connected to management compensation creates a team that actively participates in hitting the target.
The discipline of prime cost management is not complicated. The execution is. Make it a weekly ritual, share the results, and respond to variances while they can still be corrected.
→ Read more: Break-Even Analysis and Restaurant Profitability
→ Read more: Financial Benchmarks by Restaurant Concept