· Menu & Food · 8 min read
Bar Menu Creation: Building a Profitable Beverage Program
A practical guide to building a bar menu that aligns with your concept, achieves target pour costs of 18–24%, and drives profitable check averages.
Building a bar menu is not the same work as building a food menu. The economics are different, the psychology is different, and the operational requirements are different. Beverage programs, when structured well, generate significantly higher margins than food: target pour costs of 18–24% compared to food cost benchmarks of 28–35%, according to industry data from The Restaurant HQ. That structural advantage is real, but it does not arrive automatically. It requires deliberate decisions at every stage of the process.
Here is each stage in sequence, with the data and decision logic behind each step.
Step 1: Align the Menu with the Concept
The beverage program must reinforce what the rest of the restaurant already says about itself. A craft cocktail program signals a certain level of skill, price point, and ambiance. A sports bar that leads with rare whiskeys is sending mixed signals. Before building the menu, answer three questions: Who is your customer? What price range do they expect? What does a drink order from your bar communicate about their night?
The concept alignment question is not abstract. It shapes every subsequent decision: which categories to include, how much menu space each gets, what staffing skills you need, and how elaborate you can make the drink development process. A neighborhood wine bar dedicates most of its menu real estate to its bottle and glass program. A cocktail bar leads with its original creations. A casual dining restaurant keeps its bar menu supportive of food sales without demanding serious bartending expertise.
Step 2: Build a Balanced Category Structure
A complete bar menu covers six categories, proportioned according to concept emphasis:
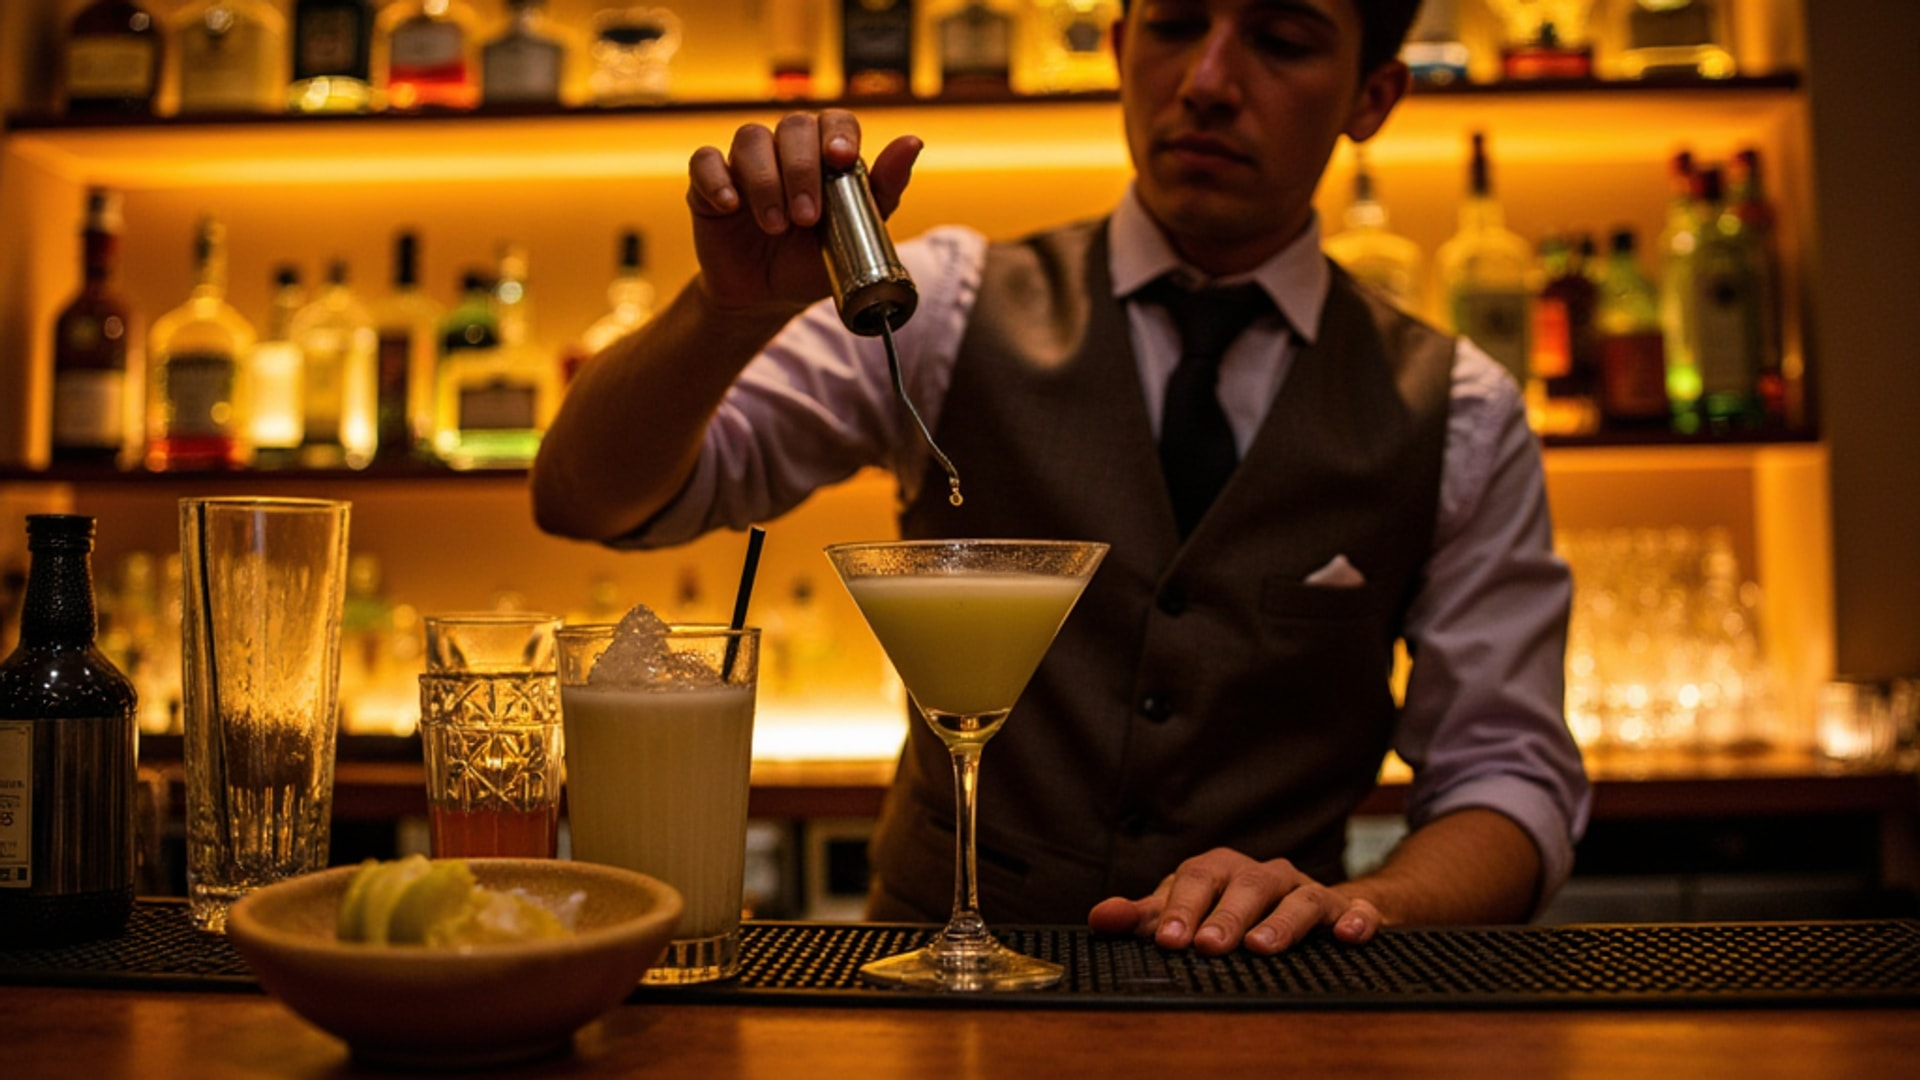
Signature cocktails — the bar’s identity. These should be original, executable at volume, and representative of the program’s personality. A target of 10 to 12 total cocktail options provides variety without overwhelming the customer or the bartender. Provi’s guide to cocktail menu development recommends a flavor matrix covering four quadrants: light and refreshing, adventurous and complex, strong and aromatic, and comforting. Aiming for roughly equal representation across these quadrants ensures the menu has something for every palate.
Spirits selection — organized by base spirit (gin, whiskey, tequila, vodka, rum, brandy) with enough range to support both mixing and neat pours. The depth of this section depends on the concept: a whiskey bar goes deep on bourbon and Scotch; a cocktail bar keeps it functional.
Beer — craft, import, and mainstream options. Tap lines are the most visible and immediate beer statement; bottles and cans round out the program. The ratio of craft to mainstream reflects both your customer base and your margin goals.
Wine — even in non-wine-focused bars, a basic wine selection is expected. By-the-glass options at three price points (entry, mid, and premium) serve most customers. Bottle options expand the program for table service.
Non-alcoholic beverages — no longer an afterthought. Consumer demand for zero-proof options has grown across all venue types, a shift tracked closely by the Distilled Spirits Council. The Restaurant HQ notes that non-alcoholic options are now expected in any complete bar program. Skip them and you lose tables.
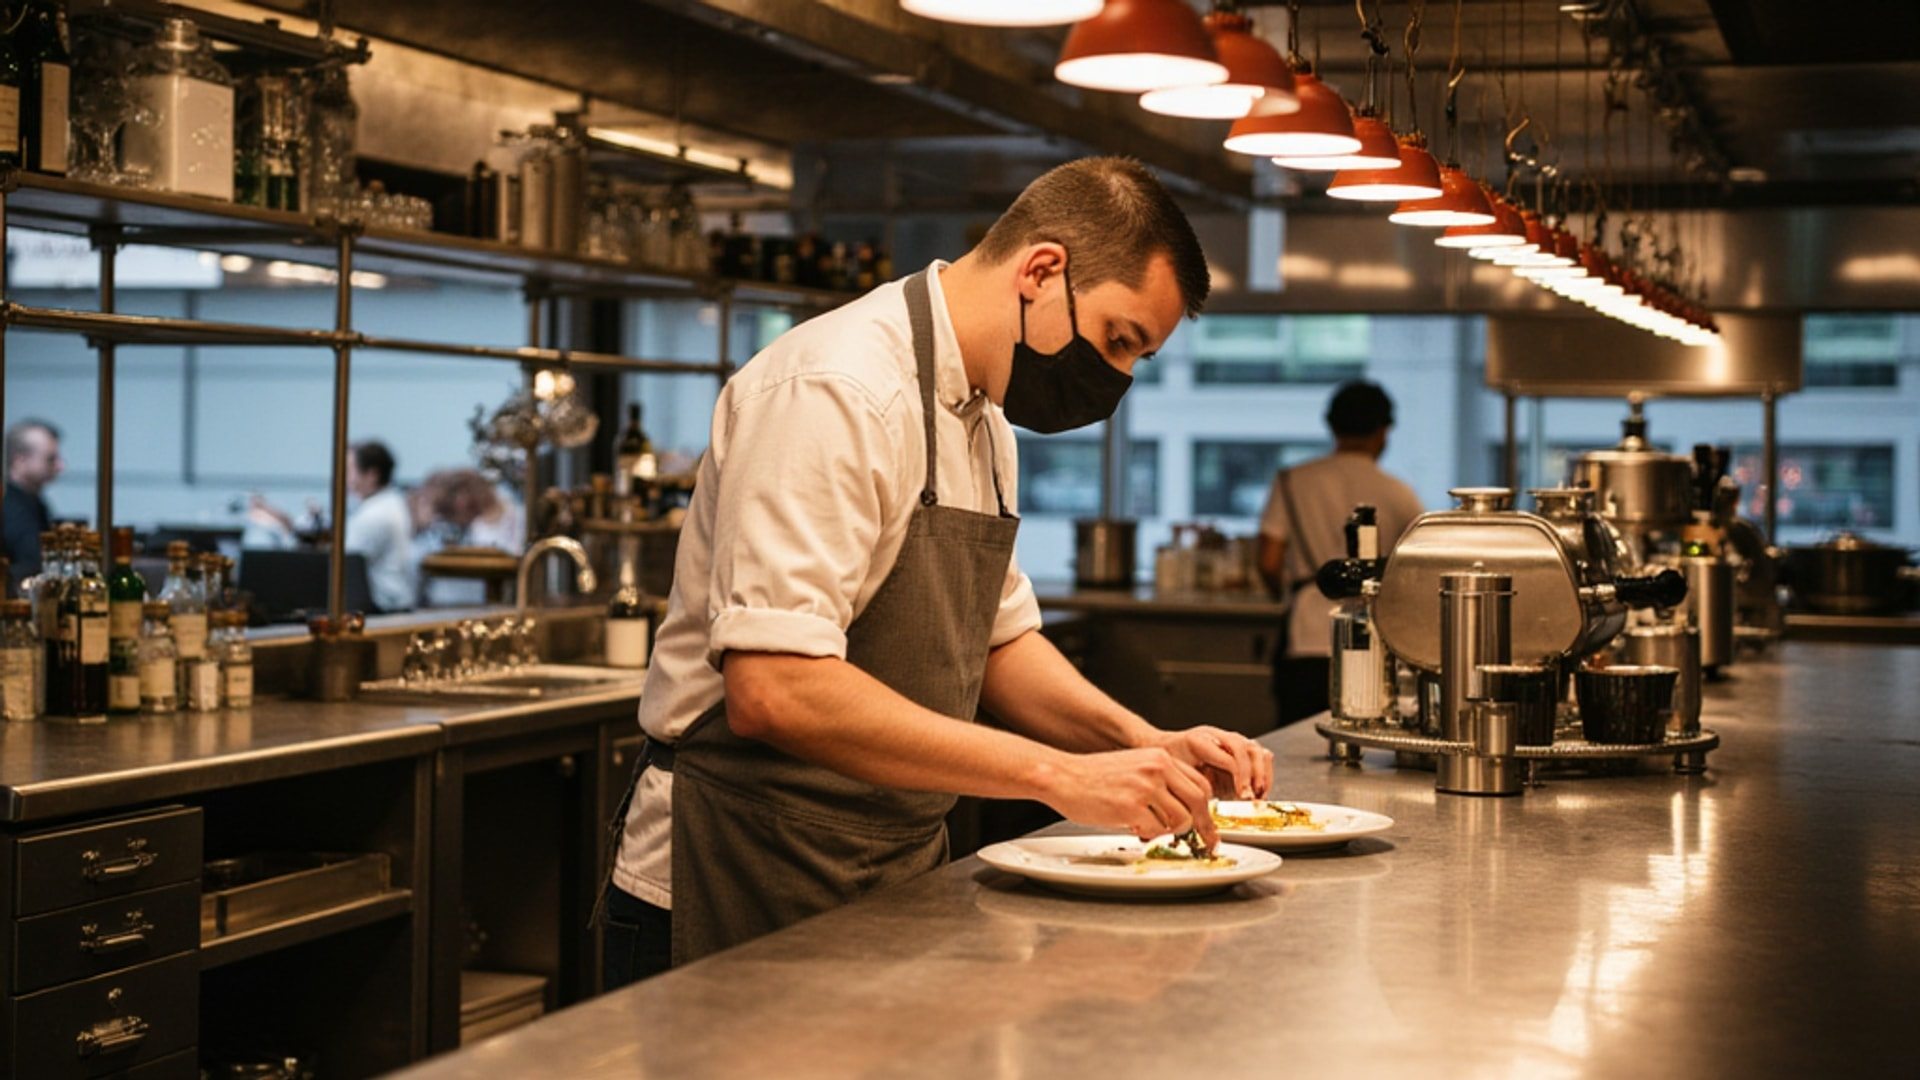
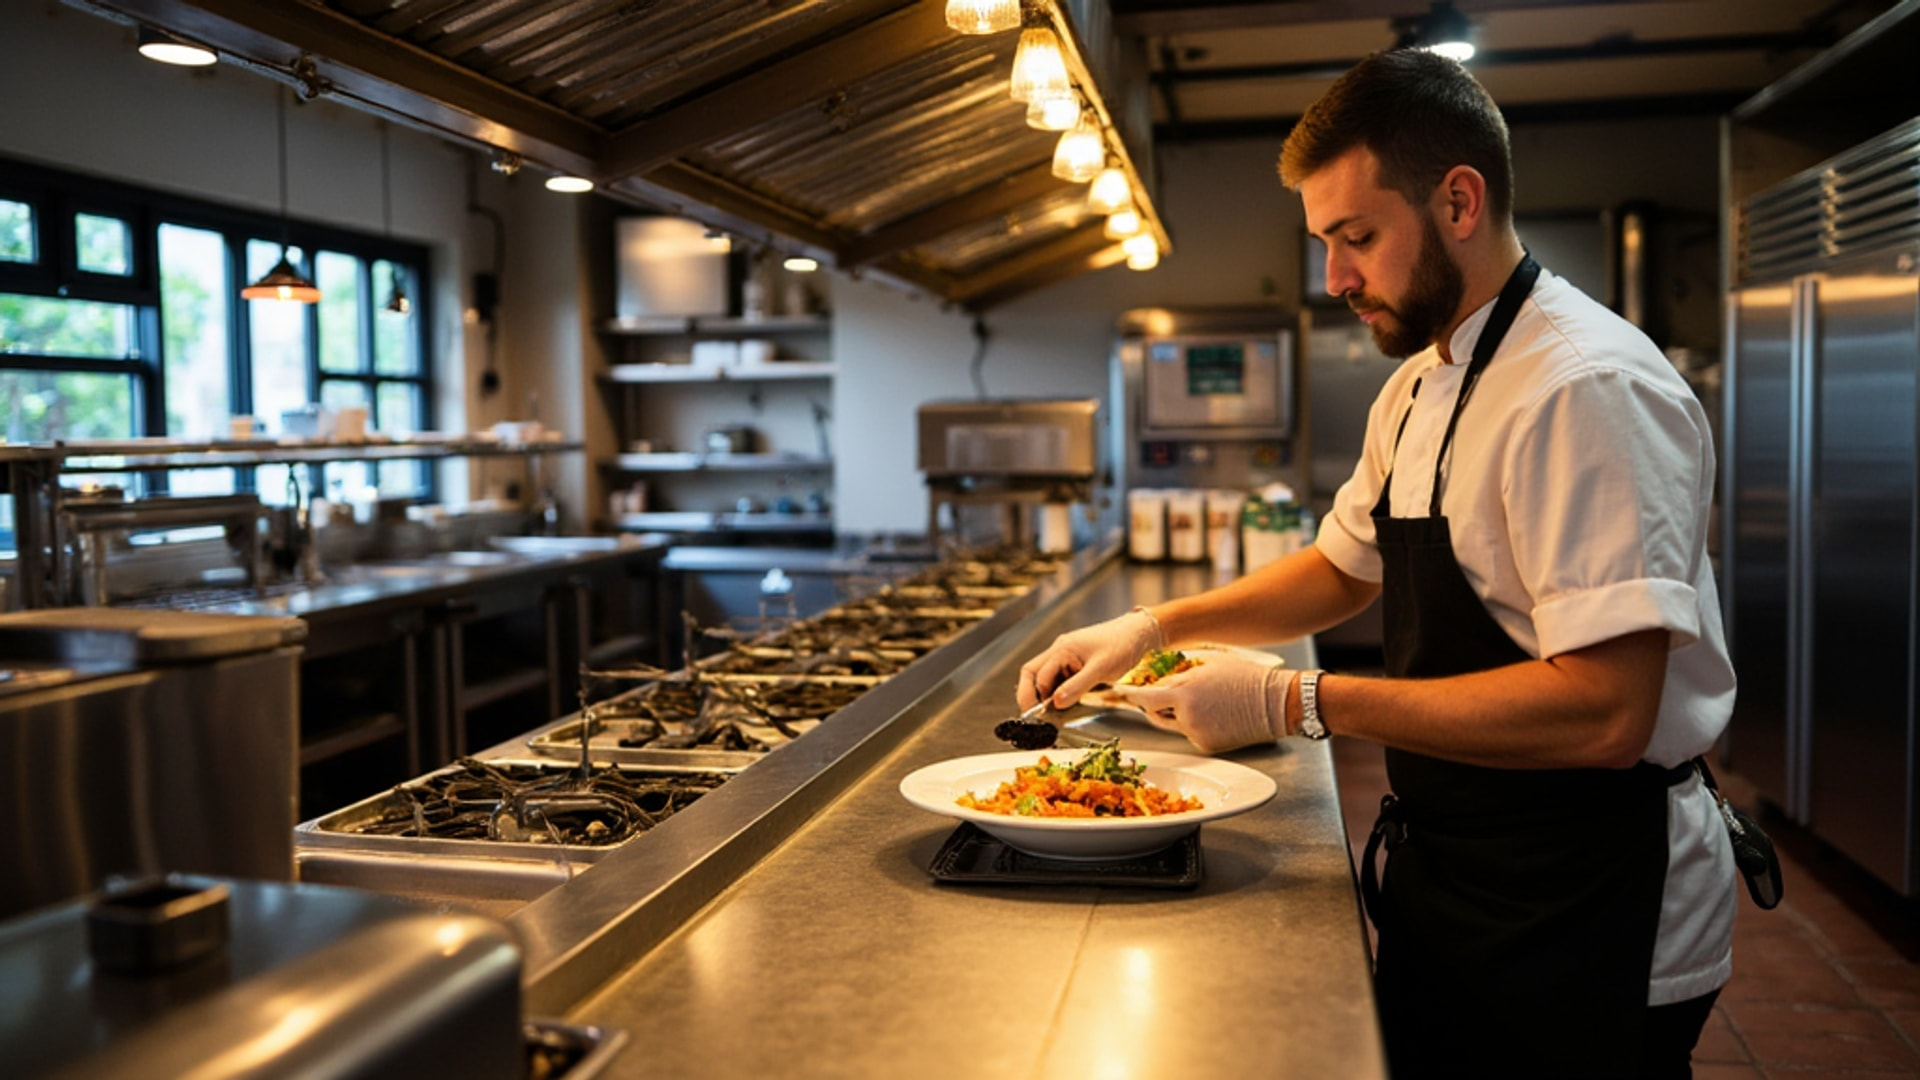
Bar food — quick, high-margin snacks designed for sharing. Bar food extends dwell time, leads to additional drink orders, and improves per-table revenue without requiring significant kitchen complexity.
Step 3: Decide on In-House versus Purchased Ingredients
The decision about making versus buying syrups, infusions, bitters, and specialty garnishes has direct margin implications. In-house production is typically more cost-effective than purchasing pre-made alternatives, and it enables flavor differentiation that competitors cannot easily replicate.
A house grenadine made from fresh pomegranate juice and sugar costs a fraction of commercial grenadine and tastes dramatically better. House-made falernum, orgeat, or herb-infused syrups become genuine menu differentiators. However, each in-house ingredient requires staff time, consistent quality control, and a regular production schedule. Those labor costs must be factored into the drink’s total cost. They do not disappear simply because you are making the product rather than buying it.
The practical rule: make in-house what creates meaningful quality or cost differentiation and can be produced efficiently at your volume. Buy what requires specialized production equipment you do not have or what adds negligible differentiation.
Step 4: Cost Every Drink Individually
Pour cost management begins with individual drink costing. The core formula is straightforward: pour cost percentage equals cost to make the drink divided by the price sold, expressed as a percentage. Working backward, the target menu price equals liquor cost divided by your target pour cost in decimals.
Pour cost targets vary by liquor tier. WISK’s cocktail costing methodology sets well spirits at 30% pour cost, call brands at 25%, premium spirits at 20%, and super-premium selections at 15%. These tiered targets reflect both the higher absolute cost of premium spirits and the higher price ceiling that customers accept for them.
A practical worked example: a gin costs $32 per 750ml bottle. That is 25.4 fluid ounces per bottle, yielding a per-ounce cost of $1.26. A cocktail using 1.5 ounces of gin has a base spirit cost of $1.89. Add the mixer, garnish, and a 20% variance for spoilage and waste, and the total drink cost might reach $2.75. At a 20% pour cost target, the formula yields a menu price of $13.75 — which you round to $14 for menu consistency.
Non-alcoholic ingredients require separate, careful accounting. Fresh juice yields vary significantly from whole fruit. The juice from a pound of limes depends on how ripe they are, and that variability needs to be factored into costing assumptions. Mixer and garnish costs for popular cocktails can add $0.50 to $1.50 per drink, enough to matter at scale.
Step 5: Write Descriptions That Sell
A well-written cocktail description does more work than most operators realize. Provi’s cocktail guide recommends descriptions that follow a hierarchy: base spirit first, primary modifier second, additional ingredients and flavor notes third. Enhanced language that highlights infusions, house-made elements, and specific brands outperforms generic ingredient lists.
Compare these two descriptions for the same drink:
“Vodka, elderflower liqueur, lime juice”
versus
“House-infused cucumber vodka, St-Germain, fresh lime, topped with sparkling water — crisp and aromatic”
The second version communicates flavor, technique, and care. It also creates permission for a higher price point. Removing currency symbols from menu prices (writing “14” instead of “$14.00”) psychologically distances the cost from the pleasure of ordering, a technique supported by multiple studies in menu psychology, including research from the Cornell School of Hotel Administration.
Step 6: Set Prices Against the Competitive Market
Formula-derived prices are starting points, not final answers. WebstaurantStore’s beverage pricing analysis shows that urban establishments with higher overhead charge more than rural bars with identical ingredient costs. An upscale cocktail bar in a city center targets 18% pour costs on premium cocktails priced at $14–$18. A neighborhood sports bar runs 30% pour costs on beer at $5–$8. A wine bar targets $12–$14 per glass.
This range reflects both the cost structure and the market’s willingness to pay, and those two factors must be reconciled. A cocktail that the formula says should sell for $16 in a market where the competitive ceiling for craft cocktails is $12 creates a problem that cannot be solved by adjusting the formula. The solution is either to find lower-cost ingredients that maintain the quality bar, reduce the portion slightly, or price to the market and accept a slightly higher pour cost on that item while compensating elsewhere.
The average bar markup on liquor is 400–500%, according to WISK. Average cocktail prices range from $5–$15, with optimal positioning between $7–$10 for standard drinks and $15+ for premium offerings. Bars target approximately 80% profit margins on alcohol sales overall.
Step 7: Pair Bar Food Strategically
Bar food serves a strategic function beyond its own margins. Quick-prep, shareable items extend customer dwell time, creating opportunities for additional drink orders. The best bar food items are designed for sharing — boards, bites, small plates — which encourages group ordering and increases per-table spend.
From a margin perspective, bar food occupies prime territory. Items like fries, fried appetizers, flatbreads, and charcuterie boards use low-cost ingredients with high perceived value. A $4 shareable basket of fries that drives two additional rounds of drinks at $13 each is worth more to the bottom line than its food margin suggests.
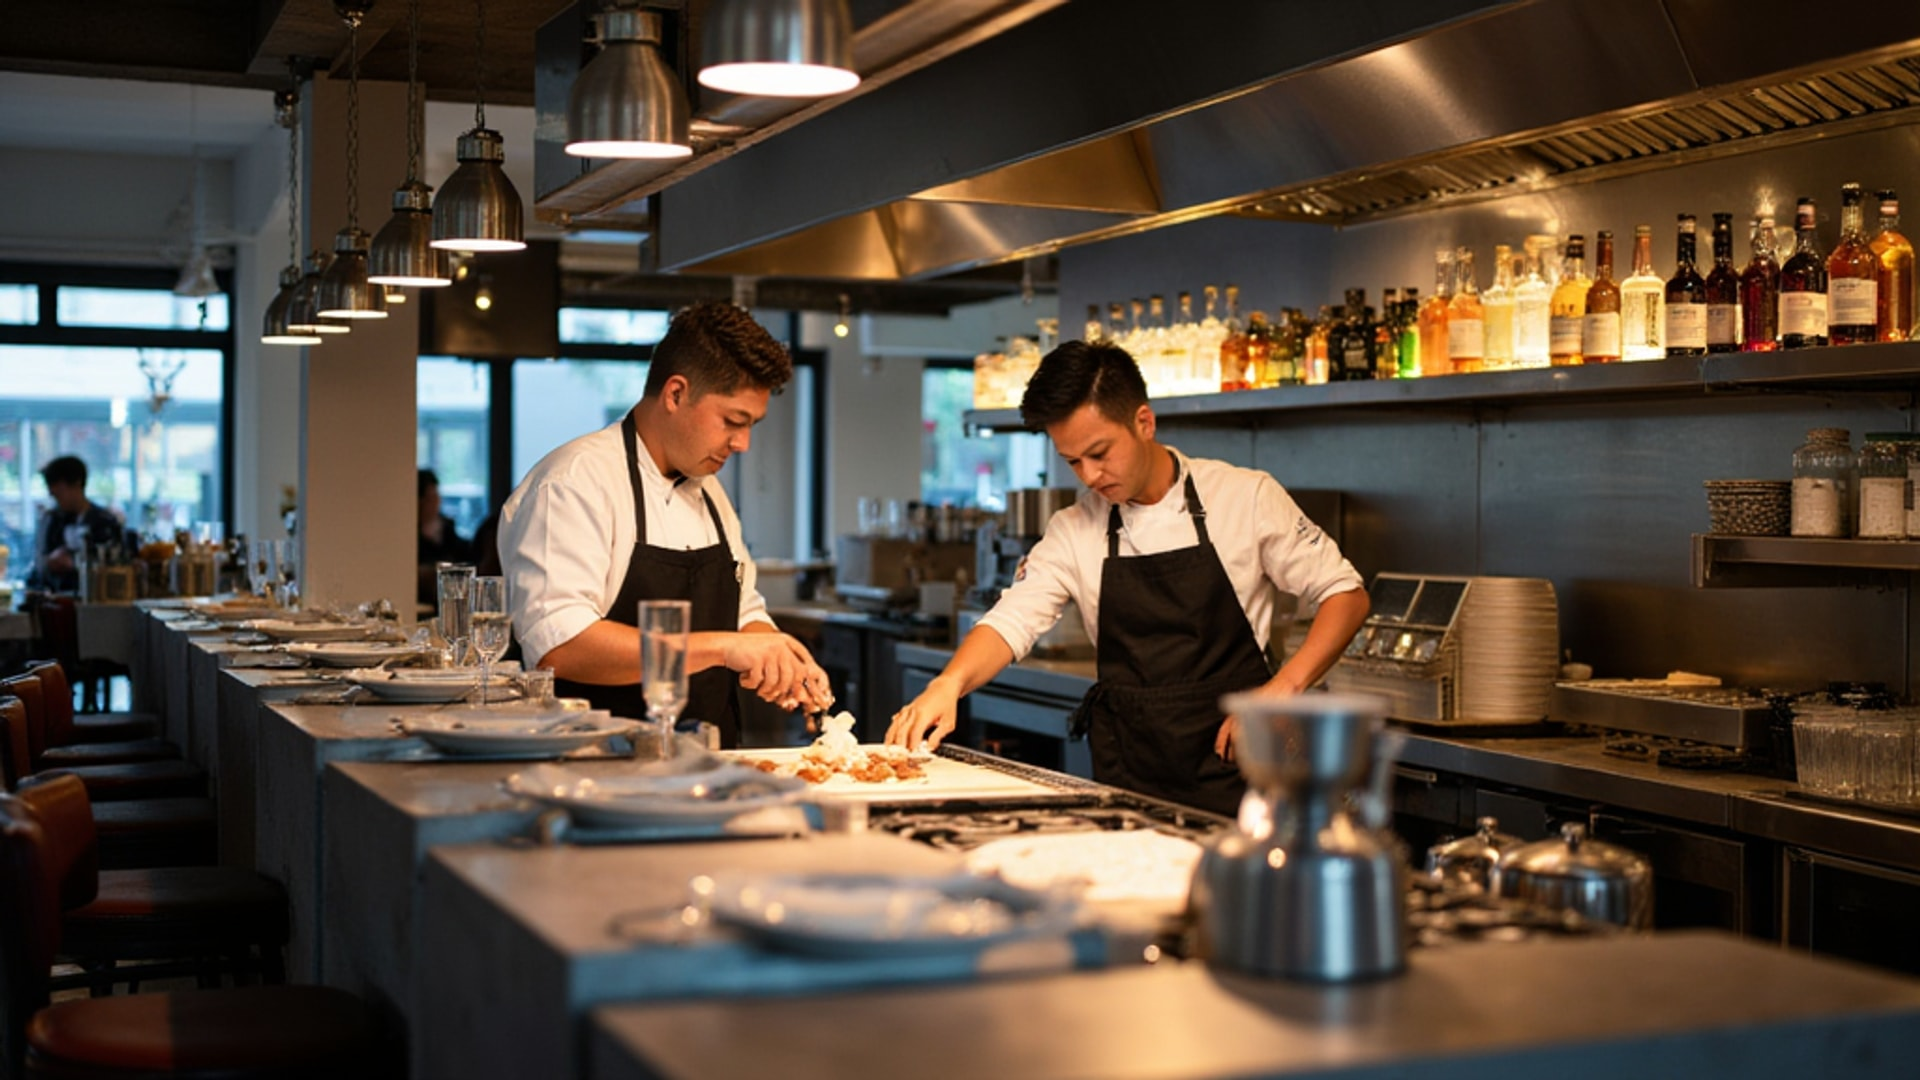
Keep bar food execution simple enough that it does not tax the kitchen during peak bar hours. The goal is complementary, not competitive.
Step 8: Review and Rotate Quarterly
A bar menu is not a static document. Seasonal rotation maintains guest interest and lets you capitalize on seasonal preferences: winter cocktails featuring warm spirits and spiced ingredients, spring menus with floral infusions, summer programs built around citrus and tropical flavors. Provi’s cocktail development guide recommends setting quarterly reminders aligned with industry product releases to ensure consistent rotation.
Beyond seasonal changes, regular review catches ingredient cost drift before it compounds. Spirit prices fluctuate with distribution and import conditions. A cocktail that was profitable at 20% pour cost in January may have shifted to 25% by October if a base spirit’s wholesale price increased. Monthly cost tracking prevents this drift from accumulating silently.
The ultimate test of a bar menu is whether it performs: drink quality, guest satisfaction, and the numbers on the P&L at the end of the month. A beautiful menu that bleeds margin is just an expensive piece of graphic design.